

Self-service business intelligence (SSBI) has long been the holy grail of data warehouse architectures. Many business intelligence software vendors like Tableau, Qlik, and Microsoft (Power BI) like to make SSBI appear to be as easy as getting data into a data model and handing it off to business analysts.
The reality is that delivering a data set that allows business users to build their own reports and dashboard requires a great deal of planning, architecture, and governance to ensure that users can:
- Understand the data values they’re looking at
- Manage the created reports and dashboards to ensure their data integrity
- Have consistent understanding of data, and its values across the entire company
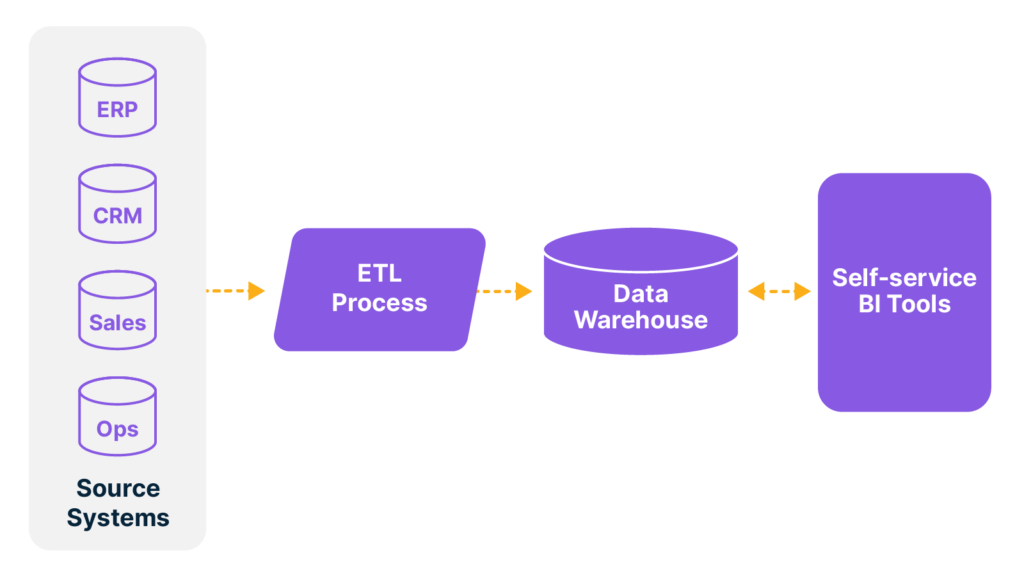
Figure 1 provides a high-level view of SSBI design. There are many variations on this theme, but at its core, business intelligence gets data from source systems that provide operational functionality.
It then uses a process of extraction, transformation, and loading to ingest that data into a reporting-optimized pattern in a data warehouse (which is traditionally another database itself), called a star schema.
The star schema is made up of facts and dimensions—a fact table, for example, would house individual sales data containing keys referencing products, dates, and geography information. These keys can be joined to dimension tables further describing those properties.
While getting this data into a data warehouse allows BI developers to easily build reports on request without impacting source systems, data in a data warehouse isn’t usually at a point where business users can start using it.
For that to happen, a semantic layeris created, which helps translate esoteric column names like ProductID and EnglishProdNm into terms like Product SKU and Product Name that business users can more easily understand.
This layer is also used to help define key metrics and calculations for important business questions, which allows a consistent definition for those questions. When the semantic layer is correctly defined, it allows business users to quickly and easily drag-and-drop data elements into a reporting tool and be assured that the data is correct.
Reducing Complexity
Another goal of the semantic layer is reducing complexity within the data to simplify reporting for business users. Those SSBI users shouldn’t have to understand the difference between inner and outer joins or the basics of SQL syntax.
That simplification can be done through things like dimensional modeling, ensuring data consistency, and making sure the SSBI users can’t accidentally bring down the data warehouse with a couple of bad reports.
And those users shouldn’t have to be concerned with the complexities of your dimensional model. You should work to simplify the presentation of your physical data sources within the self-service model to make life easier for them.
Governance
While having a semantic layer and handing off reports to customers is critical, the most important part of any reporting effort is data governance. Data governance includes rules about how data is sourced, cleansed, managed, distributed, and used in your BI systems.
Data governance can also include a master data list. This helps resolve data conflicts of the type that can happen when, for example, a customer address is entered two different ways in two different systems.
It can be hard to kick off a data governance effort, especially if the company is undergoing a business intelligence project. Don’t let those challenges deter you, though—the value of governance is in ensuring that data can be trusted.
Having trusted data means better data and easier reporting. Having quality data that’s consistent will help increase the adoption of your SSBI effort, because analysts will be more apt to use those tools, instead of relying on their own legacy Excel spreadsheets complete with esoteric formulas that aren’t centrally managed.
Beyond the benefits for your business intelligence reporting, data governance has many benefits around security and metadata management that can help your organization become more data focused.
Training and Process
Building all the best tools doesn’t mean that your users will immediately find them intuitive and easy to use. The most commonly used business intelligence tool is still Excel—many business and finance users are most comfortable using spreadsheets, and will take some coaxing to use more modern BI tools.
Your users need training to get there, of course. But it goes beyond just learning new tools they’re using—they need to learn how the data works, so they can start building and expanding their own models as they get more comfortable working with their own data.
Training users isn’t as simple as running a one-time weeklong training class—you need to mentor users and ensure they’re getting the benefits of the tools and processes in place.
Another consideration is that most SSBI tools provide metadata on usage. It’s important to understand how, and how often, data is being used within the organization. This facilitates gauging adoption and focusing mentoring efforts where utilization is lower.
Worth the Effort
SSBI vendors frequently sell the ease of use of their tools and platforms without mentioning the process complexity that’s involved in building those data models.
It’s important for both IT and business organizations to understand the significant effort level involved in a successful SSBI project. Beyond just implementing a data warehouse and a semantic layer, you need to ensure data is consistent and correct throughout your systems, which also means undergoing the frequently painful process of a data governance project.
While data governance is hard, it pays infinite dividends that go far beyond the impact of making business intelligence much easier. But you won’t get there unless you ensure that your users have the training they need to be successful, and are using the tools as intended.
